

A dedicated server delivers exclusive hardware access, yet even a fully isolated machine can show sharp IOPS drops the moment sustained workloads hit the storage subsystem. When that happens, the symptom is obvious — database queries slow, write queues back up, application latency climbs — but the root cause is rarely where engineers first look.
Drive age is the instinctive suspect, yet the actual offender is just as often a saturated RAID controller cache, a misconfigured I/O scheduler, or a queue depth setting that made sense at provisioning time but no longer matches current workload patterns. The diagnostic challenge is that these causes produce nearly identical surface symptoms.
A throughput graph does not tell you whether you are hitting the physical limits of your drives, exhausting controller write-back cache, or simply starving the storage pipeline because the OS is issuing I/O in a pattern the hardware was never tuned to handle. Without a structured, layer-by-layer approach, engineers cycle through hardware swaps and firmware updates that address the wrong layer entirely — consuming time and budget while the real bottleneck remains untouched.
Why IOPS Degrades Under Sustained Load — and Why It Is Hard to Diagnose
IOPS degradation under sustained load is a multi-layer problem because storage performance depends on at least four independent subsystems working in concert: the physical media, the RAID controller, the queue depth configuration, and the OS-level I/O scheduler. When any one of these layers becomes the bottleneck, the symptom at the application level looks identical — slower queries, growing write queues, rising latency — regardless of which layer is actually responsible.
That surface-level uniformity is precisely what makes diagnosis difficult: you cannot determine the root cause by observing the symptom alone, and acting on the wrong layer wastes time while the actual constraint continues to compound.
The most common misdiagnosis stems from how short-burst benchmarks interact with controller cache. A synthetic test that runs for thirty seconds will frequently report healthy throughput because the RAID controller's write-back cache absorbs the burst before the underlying drives are meaningfully stressed. Under sustained load, that cache fills and the controller is forced to flush writes directly to disk.
Throughput drops sharply at that point — not because the drives degraded overnight, but because the workload finally exceeded what the cache could buffer. Engineers who ran a clean benchmark at provisioning time have no obvious reason to suspect the controller, so they chase drive health metrics instead and find nothing conclusive.
Queue depth introduces a second layer of confusion: a value that was appropriate for small sequential writes becomes a hard ceiling when the same server begins handling thousands of concurrent random read-write operations, a pattern typical of database workloads and inference pipelines. The hardware is not broken; it is operating outside the parameters it was originally configured for.
The I/O scheduler then compounds both problems independently of drive condition. A scheduler tuned for rotational media serializes requests that NVMe storage could process in parallel, adding measurable latency that has nothing to do with the drive itself and everything to do with a configuration that was never updated when the hardware changed.
Because a dedicated server grants you exclusive ownership of every hardware resource, none of these failure modes involve external contention — every bottleneck lives somewhere in your own physical stack and can be isolated with a structured sequence of targeted commands. The sections that follow provide exactly that sequence, starting at the media layer and working upward through controller, queue depth, and scheduler.

Because a dedicated server grants one tenant exclusive access to every hardware resource, storage bottlenecks surface in ways that are fundamentally different from virtualized environments where the hypervisor absorbs and redistributes I/O pressure.
What Is a Dedicated Server and Why Storage Performance Behaves Differently
A dedicated server is a physical machine allocated exclusively to a single tenant. Every CPU cycle, every gigabyte of RAM, and every IOPS the storage subsystem can deliver belongs entirely to one workload. No hypervisor layer redistributes resources, and no neighboring tenant can saturate the shared storage bus at an inconvenient moment.
That single-tenant architecture introduces an important cost alongside its advantages: there is no abstraction layer to absorb or mask degradation. On a virtualized host, fluctuating IOPS can plausibly be attributed to noisy neighbors or hypervisor scheduling — an ambiguity that, while frustrating, sometimes buys time.
On a virtualized host, the hypervisor mediates every I/O request. Even when a VM is granted generous storage allocations on paper, the underlying physical drives serve multiple tenants simultaneously. The result is that measured IOPS fluctuates with the activity of other VMs on the same host — a pattern engineers sometimes mistake for drive wear or misconfiguration on their own instance. On a dedicated server, that external variable is eliminated.
This makes diagnosis more tractable, but it also means there is nowhere else to point: if IOPS drops under, the cause lives within your own stack.
The hardware generation matters here. Modern configurations built around NVMe SSDs operate on a fundamentally different I/O model than SATA or SAS drives: the NVMe protocol supports deep, parallel command queues by design, whereas older interfaces were engineered for sequential, low-concurrency workloads.
A server provisioned with older-generation storage components will hit queue depth ceilings far sooner under concurrent database or inference workloads — not because the drives are failing, but because the interface was never designed for that access pattern. Understanding this distinction is the foundation for every diagnostic step that follows.
A structured provider comparison can help you verify which storage generation your current or prospective hardware actually uses before you begin isolating the cause.
How Drive Wear and Media Health Silently Reduce Effective IOPS
Drive wear reduces effective IOPS gradually and quietly, often long before any failure alert fires. On NAND flash storage, each memory cell has a finite number of program-erase cycles. As those cycles accumulate, the controller compensates by redirecting writes to healthier cells — a process called wear leveling. That compensation consumes internal bandwidth, which means fewer I/O operations per second reach the application layer even though the drive reports itself as healthy.
A single non-zero media error counter means the drive is already degraded, not merely aging.
The key indicator to read first is the drive's wear indicator attribute, sometimes labeled as a percentage of remaining endurance. When that value drops below a threshold the manufacturer defines, write performance degrades measurably under sustained queue depth. A secondary indicator is the media and data integrity errors counter, which records uncorrectable read errors the controller could not mask.
A single non-zero value there warrants immediate investigation; it signals that the drive is already operating in a degraded state, not merely aging. On spinning disks, the equivalent signal is the reallocated sector count: every sector the drive remaps to a spare area increases rotational seek time slightly, and a rising count under sustained load is a reliable early warning that raw throughput may continue to decline even if the drive never fails completely.
The practical diagnostic step is to run a health query against the drive's built-in self-monitoring interface and compare the raw attribute values against the manufacturer's documented thresholds — not just the pass/fail summary, which can remain green while individual attributes trend in the wrong direction. Dedicated Server Disk Failure – Reading SMART Data Early covers that interpretation process in depth.
What matters here is recognizing that degradation and workload-driven saturation produce similar symptoms but require completely different remediation paths. Distinguishing between them at the drive level is always the correct first diagnostic step, and a structured diagnostic framework — such as the one outlined in our dedicated server recommendation — provides the layer-by-layer sequence that keeps you from conflating the two.

When a RAID controller's write-back cache reaches saturation, performance collapses in a pattern that closely mimics drive failure, making it easy to replace healthy disks while the real bottleneck continues unchecked.
How Does RAID Controller Saturation Mask Itself as a Drive Problem?
The masquerade succeeds because the failure boundary sits between two components that most monitoring stacks treat as a single unit. As noted under Why IOPS , throughput collapses when the write-back cache can no longer buffer incoming I/O — but the diagnostic trap is that this boundary is invisible to tools aimed at the physical media. The drives remain healthy and largely idle, yet every endurance and error-rate check returns clean results, sending engineers down the wrong remediation path.
The edge case that makes this especially costly is automatic fallback to write-through mode. When the controller's battery backup unit is low, failed, or mid-calibration, the controller silently abandons write-back caching to protect data integrity. Every write now blocks until the media confirms it — a behavioral change that can cut effective write IOPS by an order of magnitude with no alert, no log entry visible to the application layer, and no change in drive health metrics.
A workload that ran within tolerance for months can breach SLA thresholds overnight solely because a scheduled BBU calibration coincided with a peak load window.
The most reliable early The controller cache hit ratio. Under normal operating conditions, a write-back cache should absorb the majority of write requests and flush them to disk asynchronously. A second, frequently missed The fallback from write-back to write-through mode.
This switch happens automatically when the controller detects that its battery backup unit, the component that protects cached data during a power loss, is low, failed, or undergoing a scheduled calibration cycle. Write-through mode forces every write to commit directly to disk before acknowledging the application, which can reduce effective write IOPS dramatically. The controller logs this transition, but most monitoring dashboards do not surface it by default.
Separating controller saturation from drive degradation requires reading the controller's own event log and cache statistics directly, not inferring the cause from disk-level metrics alone. Queue depth at the controller The separate measurement from queue depth at the drive interface, and conflating the two leads to misdiagnosis.
Queue Depth Misconfiguration — The Hidden Bottleneck Engineers Overlook
Queue depth misconfiguration is distinct from cache saturation or drive degradation in one important respect: it imposes a ceiling on throughput even when every other layer has headroom to spare. The failure mode is silent — workload growth compounds against the ceiling gradually rather than producing a discrete event that triggers an alert.
The practical decision rule is to match nr_requests to the concurrency model of the media, not to the OS default inherited from a prior configuration. On rotational arrays, a low value protects against seek-latency compounding across a deep queue. On NVMe namespaces capable of sustaining several hundred concurrent commands, that same conservative value leaves the majority of the device's throughput capability permanently unreachable.
The edge case to watch is mixed-media environments where a single nr_requests value is applied uniformly across both rotational and NVMe block devices — a common outcome of automated provisioning scripts that do not distinguish by device type.
On NVMe namespaces capable of sustaining several hundred concurrent commands, that same conservative value leaves the majority of the device's throughput capability permanently unreachable — a constraint that compounds silently as workload grows rather than producing a discrete, diagnosable failure event.
The two parameters that matter most are the hardware queue depth exposed by the storage controller and the OS-level nr_requests value set per block device in the kernel's I/O scheduler. On Linux systems, nr_requests defaults to 64 in many distributions. That default was designed for rotational media and mixed workloads.
NVMe SSDs, which can sustain queue depths of several hundred concurrent commands per namespace, are frequently underutilized when that default carries over unchanged from an older configuration. Concretely, a database server running sequential bulk writes on NVMe storage with nr_requests left at 64 will not saturate the drive's throughput capability — the queue empties and refills too slowly.
Conversely, a server running many small random writes on a SATA SSD array may see latency climb if queue depth is set far above what the controller can service efficiently.
Workload profile is the deciding variable. High-concurrency, small-block random I/O — typical of transactional databases — benefits from deeper queues. Sequential streaming workloads, such as video transcoding or large backup operations, are less sensitive to queue depth and more sensitive to scheduler choice. Identifying which profile your workload represents before adjusting any parameter is the correct sequence.

Choosing the wrong kernel I/O scheduling algorithm for your workload type can silently cap throughput long before the physical drives or controller approach their actual limits.
Which I/O Scheduler Is Costing You IOPS Under Load?
The Linux I/O scheduler is one of the most frequently overlooked variables in a storage performance investigation. It sits between the kernel's block layer and the storage driver, determining how pending I/O requests are batched, reordered, and dispatched.
Switching to the none scheduler on NVMe can unlock peak throughput that mq-deadline quietly suppresses.
Choosing the wrong scheduler for your workload profile can significantly reduce effective IOPS under concurrency — not because the hardware is inadequate, but because the kernel is serializing or reordering requests in a way that conflicts with how the storage device actually performs.
The three schedulers most relevant to dedicated server workloads are mq-deadline, BFQ, and none. The mq-deadline scheduler enforces a hard deadline on each request to prevent starvation, making it well suited to mixed read/write workloads on SSDs where fairness and bounded latency matter more than raw throughput. BFQ, which stands for Queueing, prioritizes interactive and latency-sensitive processes by allocating I/O budgets per process group.
It performs well when multiple processes compete for disk access simultaneously, but its per-request overhead can reduce peak throughput on NVMe devices under high-concurrency bulk I/O. The none scheduler — sometimes labeled noop in older kernel documentation — performs no reordering at all.
For NVMe SSDs with deep native command queues, this is frequently the highest-throughput option because the device's own firmware handles reordering more efficiently than the kernel can.
To verify the active scheduler without a reboot, read the block device's scheduler file directly from the system filesystem. Switching the scheduler is equally non-disruptive: writing the scheduler name to the same file takes effect immediately. To make the change persistent across reboots, the parameter must be set in the kernel command line or via a udev rule.
A Layer-by-Layer Isolation Sequence for IOPS Degradation
As noted under How Drive Wear and Effective IOPS, separating wear-related decay from configuration-induced bottlenecks at the drive The mandatory starting point. What that framing leaves open is the precise order in which the remaining subsystems should follow — and why deviating from that order produces misleading results.
The critical constraint is that each layer must be tested in isolation before the next is touched. When multiple variables shift simultaneously, a measured performance change cannot be attributed to a single cause. This makes the sequence a strict dependency chain, not a checklist: confirm and attempt remediation at each layer before advancing, because even a minor unresolved anomaly carries forward as a hidden confounding factor in every subsequent measurement.
A cache hit ratio that drops sharply during sustained writes points to controller saturation, which was covered earlier in this series. If the controller metrics are healthy, advance to the queue depth configuration at the block device level. A mismatch here — even a small one — can halve effective IOPS on NVMe storage under concurrency.
Once queue depth is confirmed, verify the active I/O scheduler as the final OS-layer checkpoint. At this stage, you have eliminated hardware wear, controller saturation, and queue misconfiguration as candidates. Any remaining IOPS shortfall belongs to scheduler behavior or a firmware-level interaction between the controller and the OS block layer.
Collect iostat output across all four checkpoints, not just the last one: the full diagnostic timeline is what distinguishes a genuine root cause from a coincidental correlation.
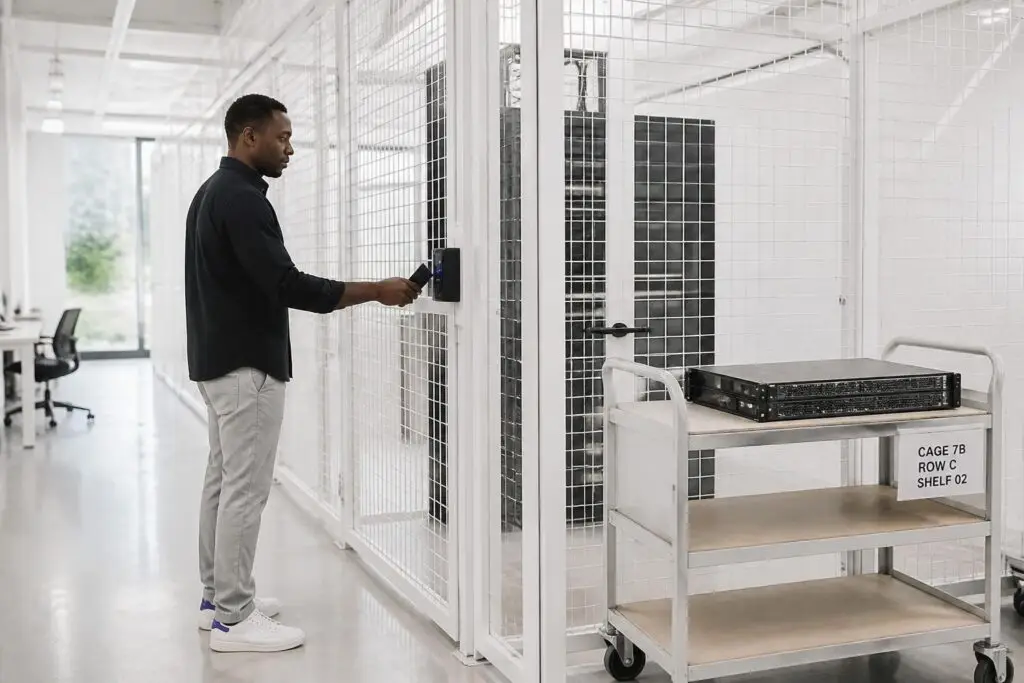
Even a modest misconfiguration in filesystem mount options can amplify an existing hardware bottleneck, turning a manageable performance dip into a severe IOPS collapse under production load.
Filesystem and Mount Options That Compound IOPS Loss at Scale
Filesystem and mount options act as a multiplier on IOPS degradation that originates elsewhere in the stack. A drive that is already stressed by wear, or a RAID controller operating near its cache ceiling, will perform measurably worse when the filesystem layer adds unnecessary write overhead on top. Correcting these options does not require taking the volume offline, and the diagnostic commands are non-destructive.
The most common filesystem-level amplifier is access-time recording. By default, many Linux systems write a timestamp update to the inode every time a file is read. Under — particularly with workloads that read thousands of small files, such as database index scans or mail queue processing — those timestamp writes compete directly with application I/O. Remounting the filesystem with the noatime option eliminates this overhead without affecting data integrity.
A related issue is journal mode configuration: a filesystem mounted in data=ordered mode writes metadata and data in a coordinated sequence that protects consistency but adds latency per transaction. Workloads that tolerate a defined recovery window can use writeback mode to reduce that overhead, shifting some journaling cost away from the critical I/O path.
Partition alignment is a less visible but equally significant factor. When a partition boundary does not align with the underlying storage block size — a common outcome of older partitioning tools or manual provisioning — every write operation crosses a block boundary and forces two physical writes instead of one. This misalignment doubles the effective write amplification on the device and compounds any IOPS shortfall already present at the drive or controller layer.
To audit alignment without downtime, read the partition start sector from the system's block device information and divide it by the device's reported physical sector size: a remainder of zero confirms alignment. The full audit sequence — covering mount flags, journal mode, and alignment verification — is documented in our dedicated server recommendation, where each checkpoint includes the exact command and the threshold value that distinguishes a contributing factor from a confirmed root cause.
Conclusion – Diagnose First, Reconfigure Second
IOPS degradation under rarely has a single origin. The diagnostic value of working through each layer — drive wear, RAID controller cache, queue depth, I/O scheduler, and filesystem configuration — lies precisely in the sequence: each checkpoint either confirms or eliminates a candidate before you touch a configuration file.
Tuning the wrong layer costs hours; eliminating candidates in sequence costs minutes.
Skipping ahead to a likely-looking fix without that elimination process is how teams spend hours tuning an I/O scheduler on a volume whose partition alignment was the actual bottleneck all along. The layer-by-layer isolation approach documented throughout this article gives every finding a defensible basis and every configuration change a confirmed reason.